'%3e%3cpath%20d='M34%20198.157C34%20137.83%2094%20180.243%2094%2027V367C94%20238.72%2034%20242.072%2034%20198.157Z'%20fill='%23FEFEFF'/%3e%3c/g%3e%3cdefs%3e%3cfilter%20id='filter0_d_1014_17416'%20x='0'%20y='0'%20width='114'%20height='394'%20filterUnits='userSpaceOnUse'%20color-interpolation-filters='sRGB'%3e%3cfeFlood%20flood-opacity='0'%20result='BackgroundImageFix'/%3e%3cfeColorMatrix%20in='SourceAlpha'%20type='matrix'%20values='0%200%200%200%200%200%200%200%200%200%200%200%200%200%200%200%200%200%20127%200'%20result='hardAlpha'/%3e%3cfeOffset%20dx='-7'/%3e%3cfeGaussianBlur%20stdDeviation='13.5'/%3e%3cfeComposite%20in2='hardAlpha'%20operator='out'/%3e%3cfeColorMatrix%20type='matrix'%20values='0%200%200%200%200%200%200%200%200%200%200%200%200%200%200%200%200%200%200.3%200'/%3e%3cfeBlend%20mode='normal'%20in2='BackgroundImageFix'%20result='effect1_dropShadow_1014_17416'/%3e%3cfeBlend%20mode='normal'%20in='SourceGraphic'%20in2='effect1_dropShadow_1014_17416'%20result='shape'/%3e%3c/filter%3e%3c/defs%3e%3c/svg%3e)
Heatmaps
AI Powered Insights: Transforming Real Estate with Cutting-Edge Heatmaps
Welcome to AI Powered Insights, your ultimate destination for advanced, hyper-local real estate data visualization. Designed with precision and powered by state-of-the-art artificial intelligence, our proprietary heatmaps deliver actionable insights to empower buyers, sellers, investors, and agents alike. Whether you're navigating the complexities of the market or strategizing your next move, our data-backed visual tools provide clarity like never before.
Explore Our Exclusive Heatmaps
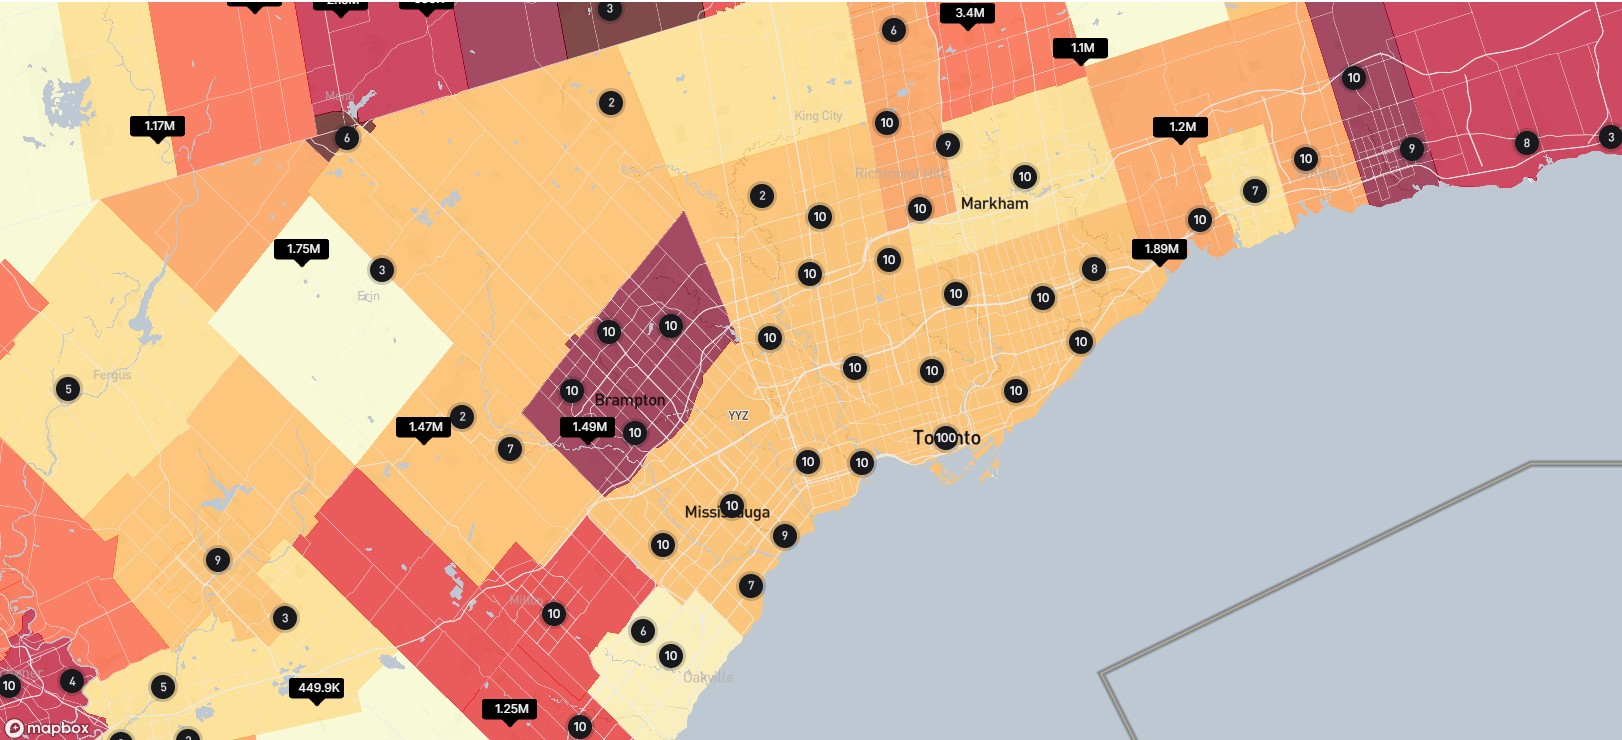
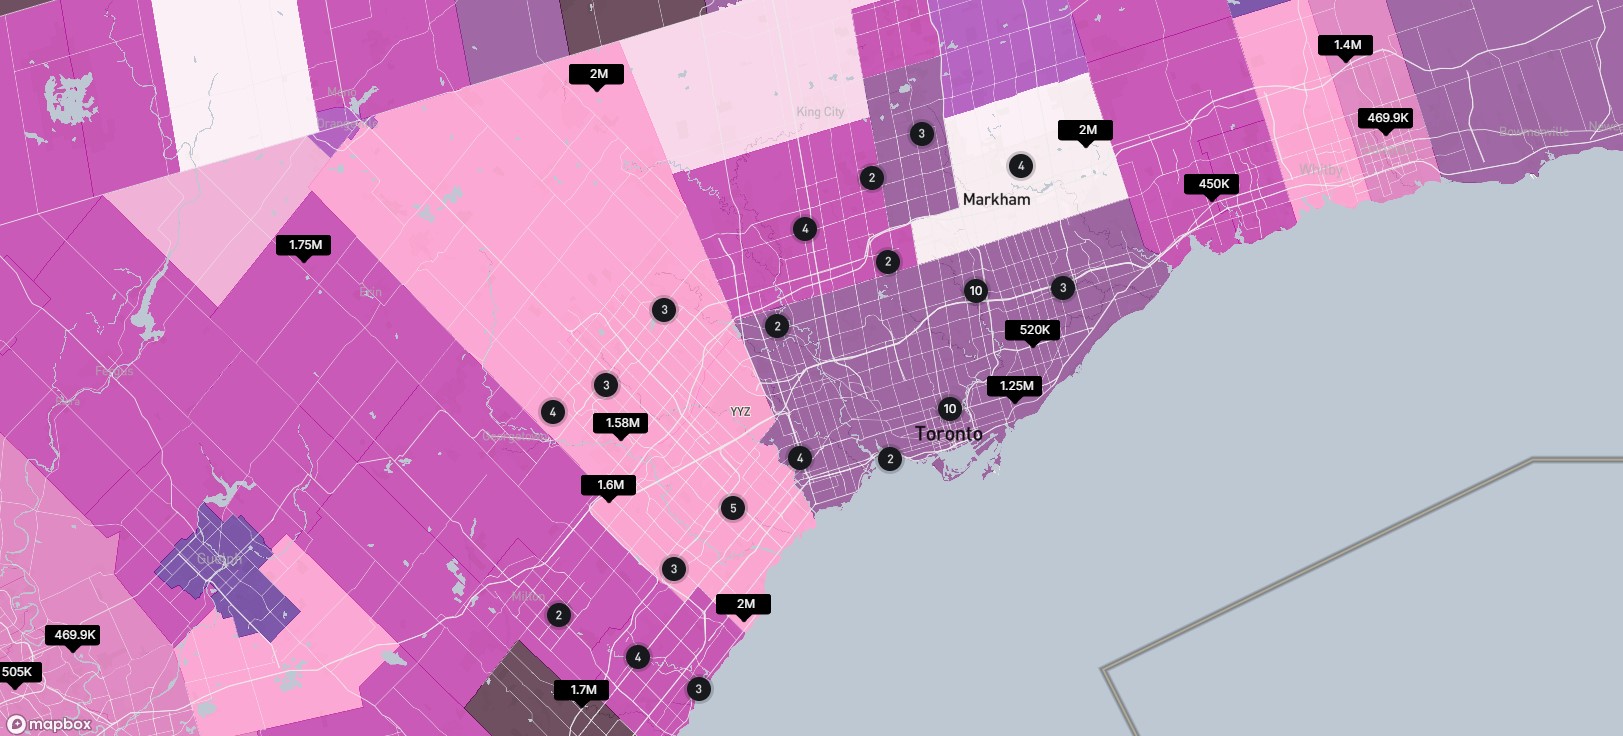
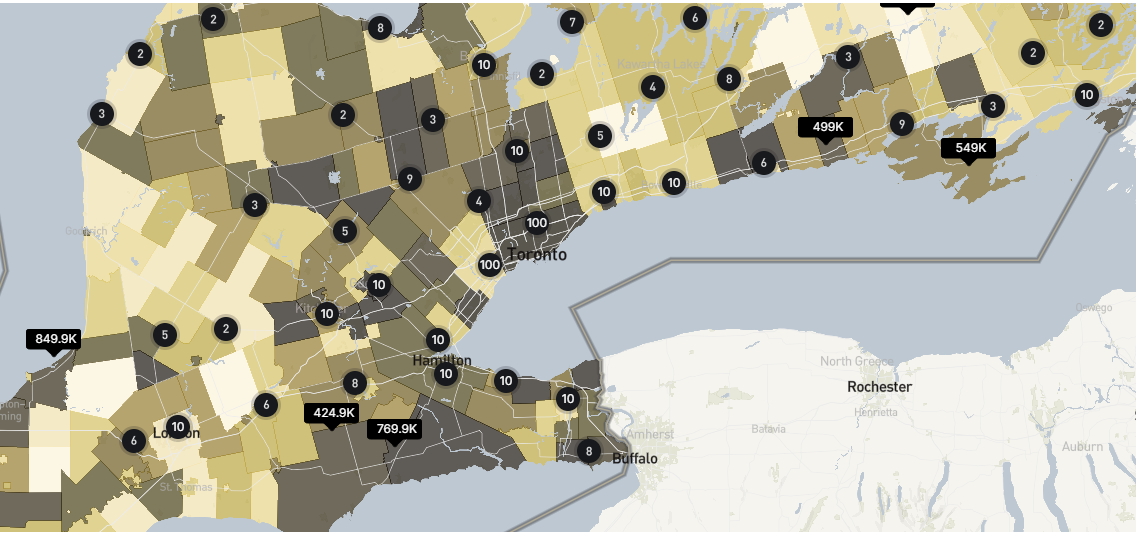
1. Median Estimated Value
Discover the estimated value of properties at the neighborhood and subdivision level. This heatmap highlights trends in home values, helping you identify lucrative investment opportunities or gauge your property’s worth with pinpoint accuracy.
2. Median Estimated Rent
Gain insights into rental market trends with our Median Estimated Rent heatmap. Whether you’re a landlord, tenant, or investor, this tool provides an in-depth understanding of rental potential in your desired area.
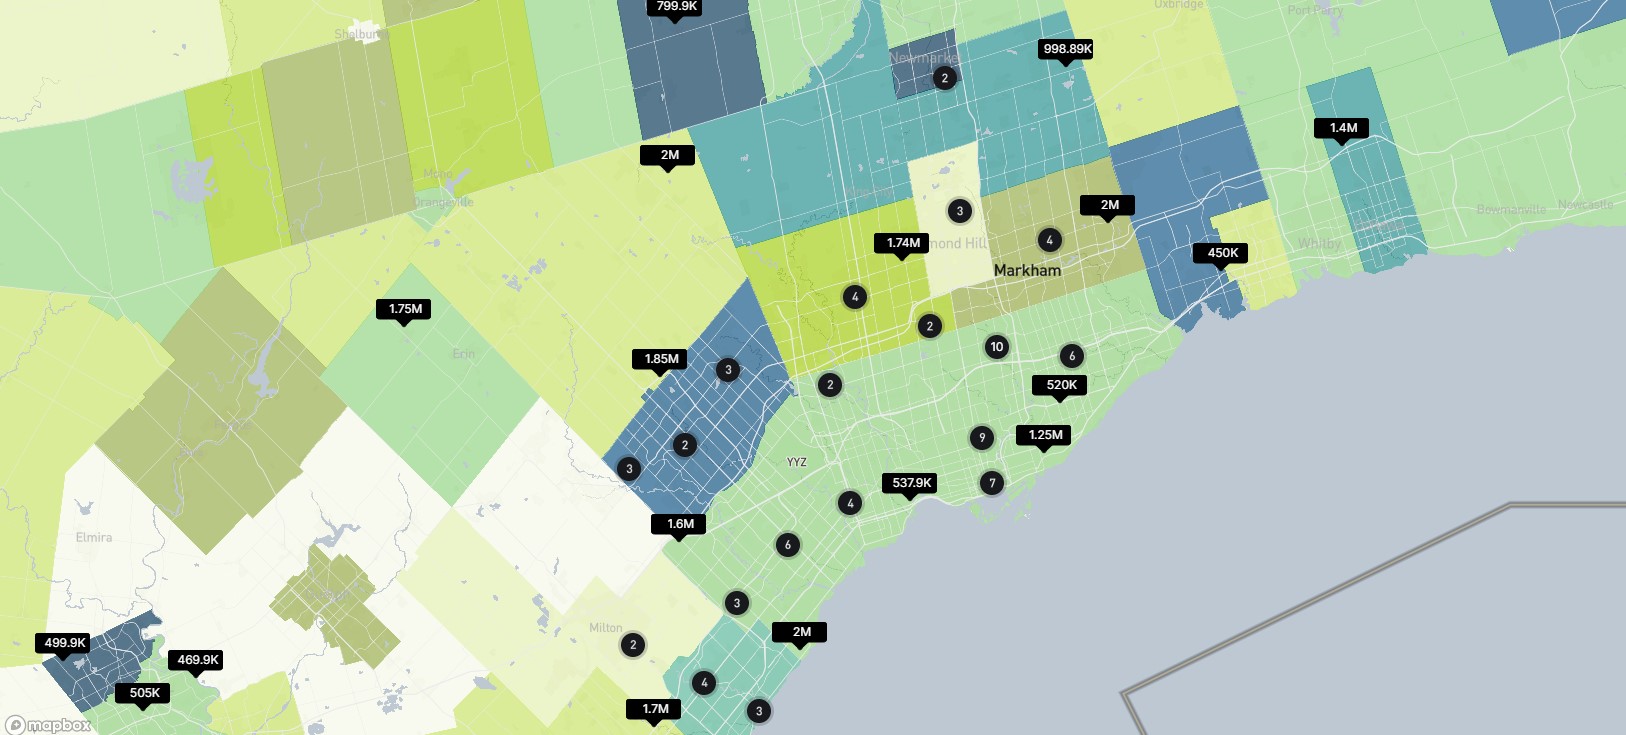
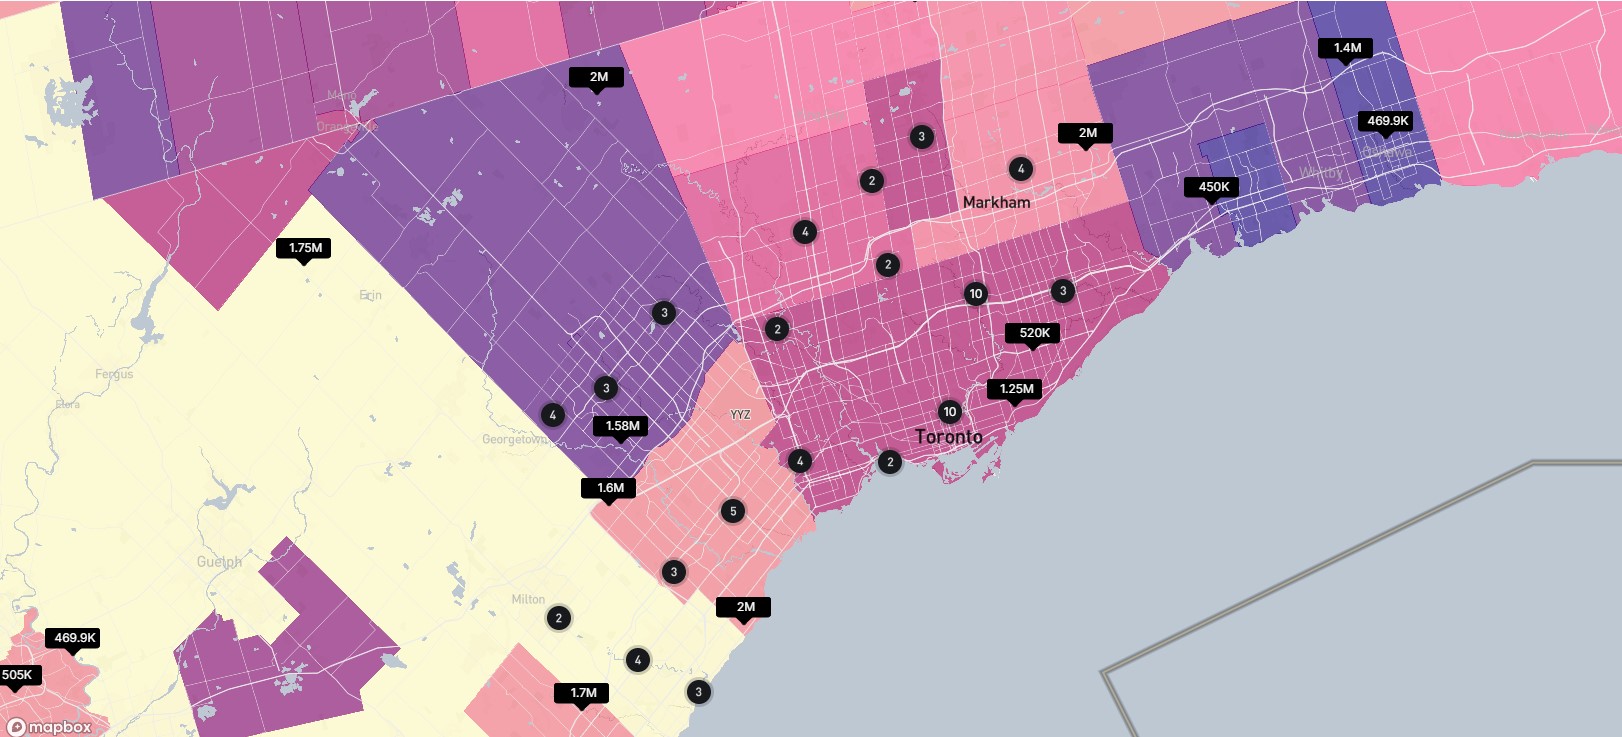
3. Housing Affordability Index
Visualize the affordability of housing across different neighborhoods. This heatmap helps you understand where housing is more accessible based on income levels and property prices.
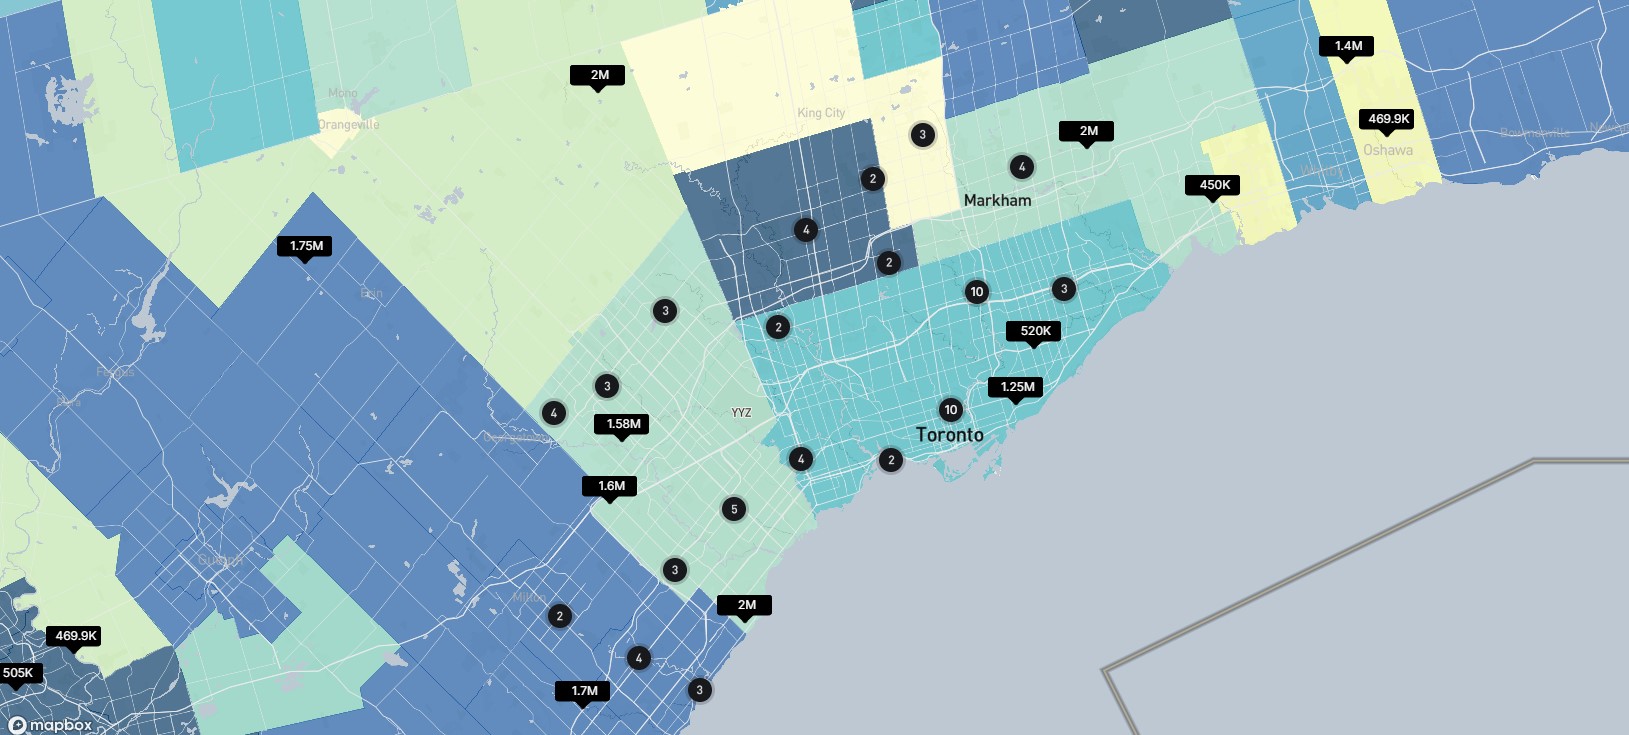
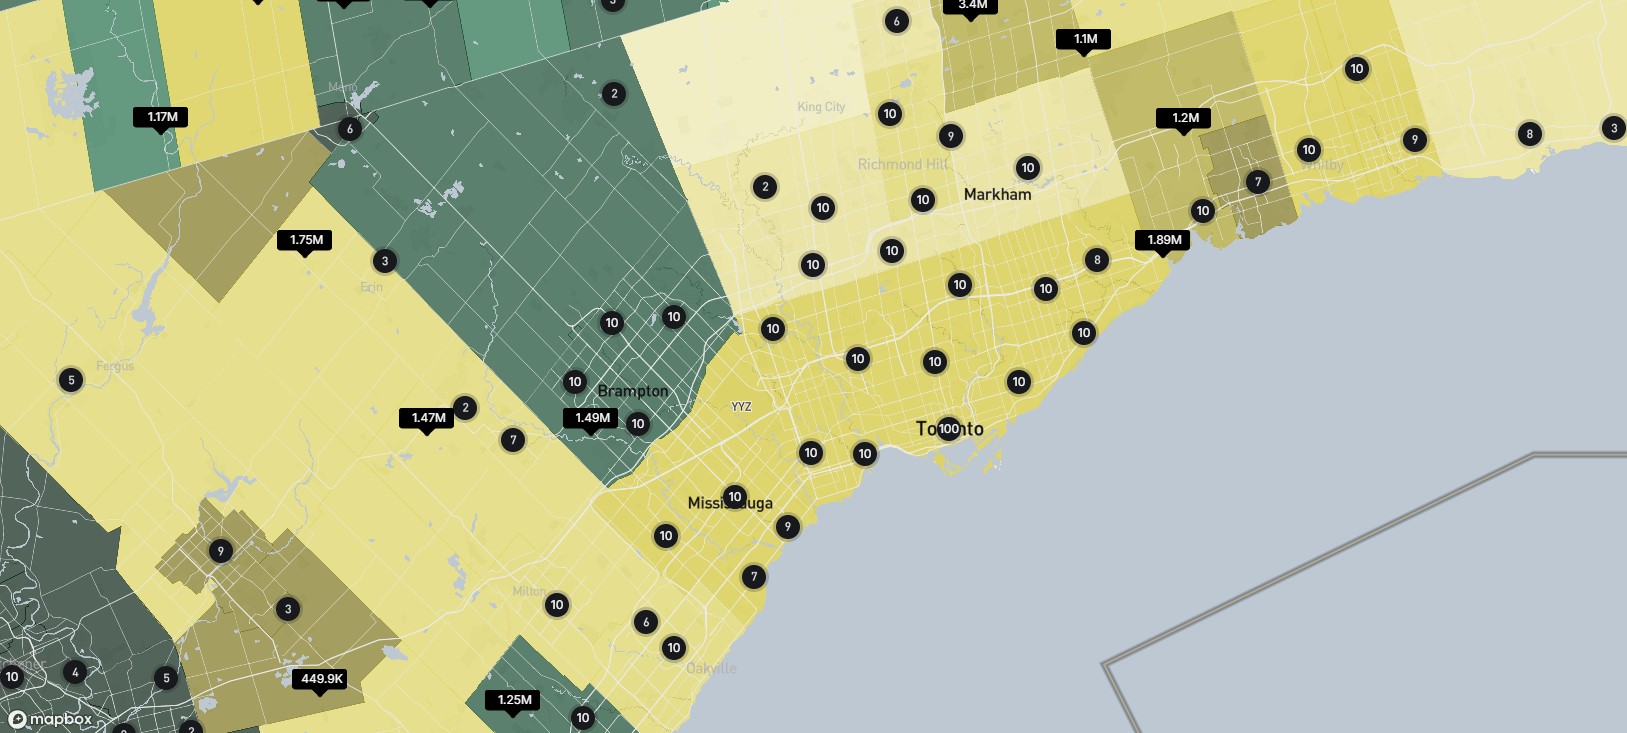
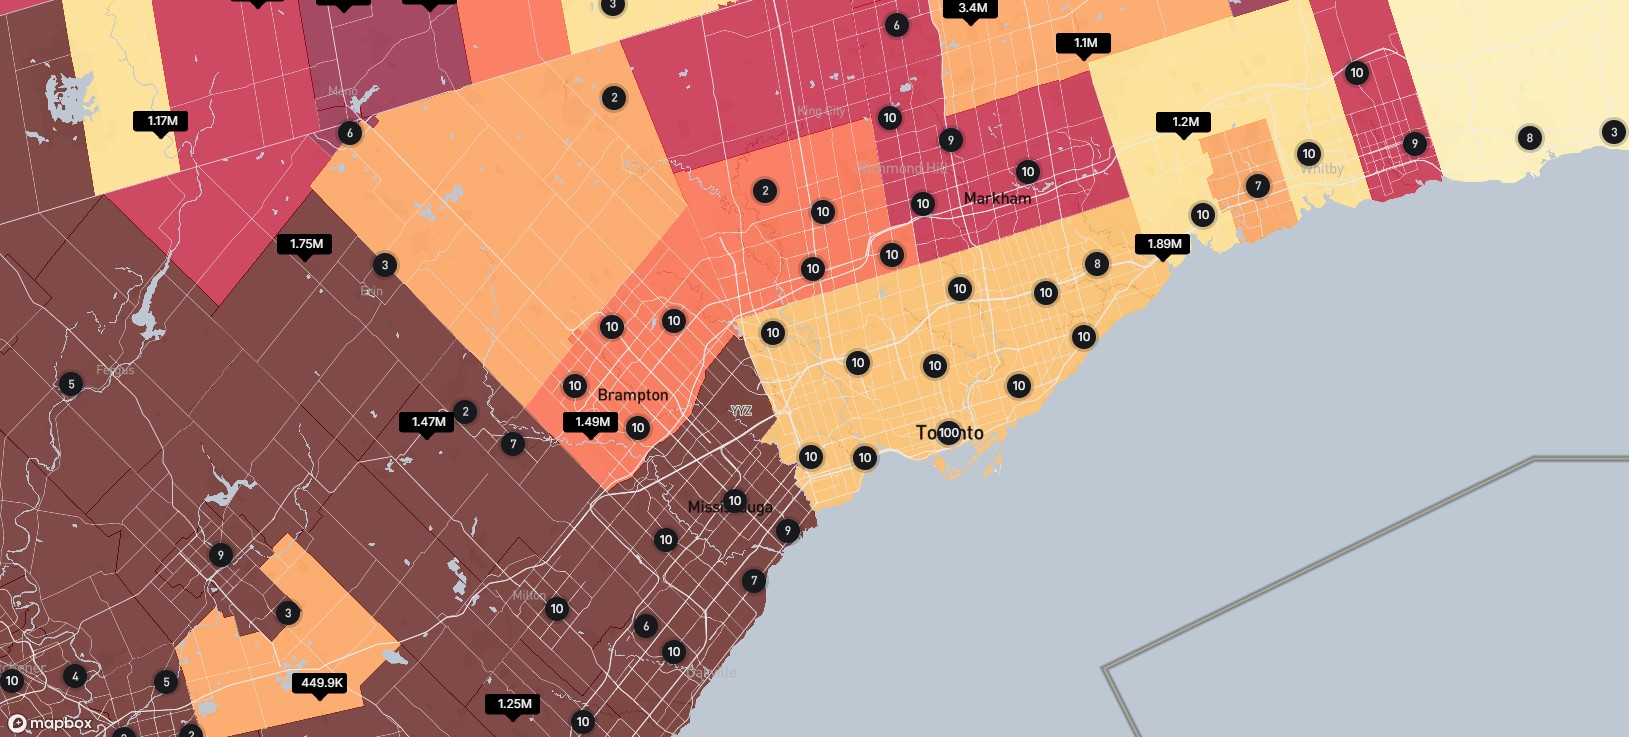
3. Median Household Income
Understand the economic landscape with our Median Household Income heatmap. This tool helps you align real estate strategies with demographic and financial insights.
5. Ownership Rate
Delve into the rate of homeownership versus rental properties in specific regions. The Ownership Rate heatmap is a critical tool for investors evaluating long-term market stability.
6. Listing Rate
Stay updated on the intensity of property listings in your area of interest. High listing rates can indicate a competitive market, while low rates may signify scarcity and potential price stability.
7. Sales Rate
Analyze how quickly homes are selling in different areas with our Sales Rate heatmap. This metric is invaluable for understanding market demand and timing your transactions effectively.
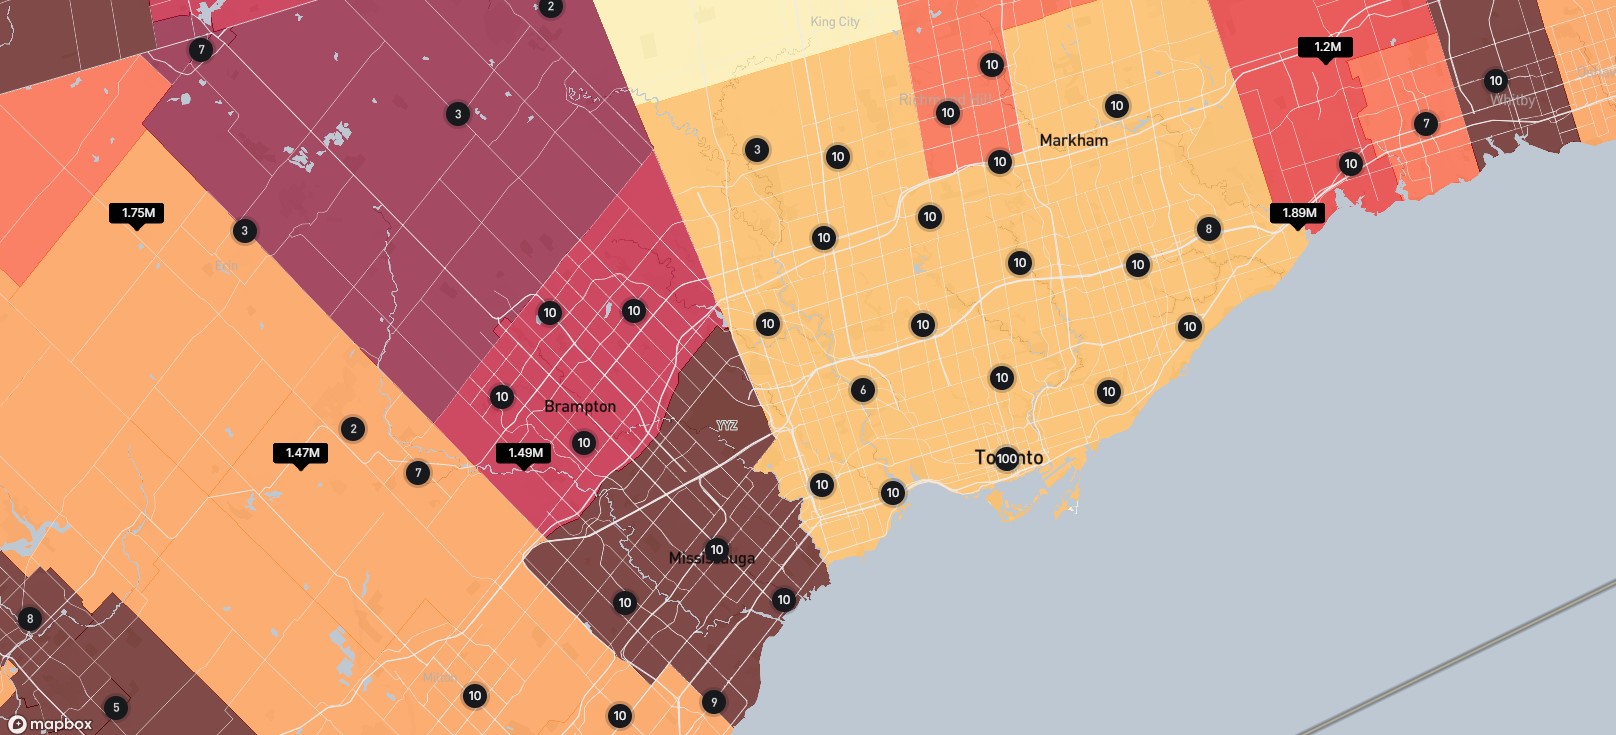
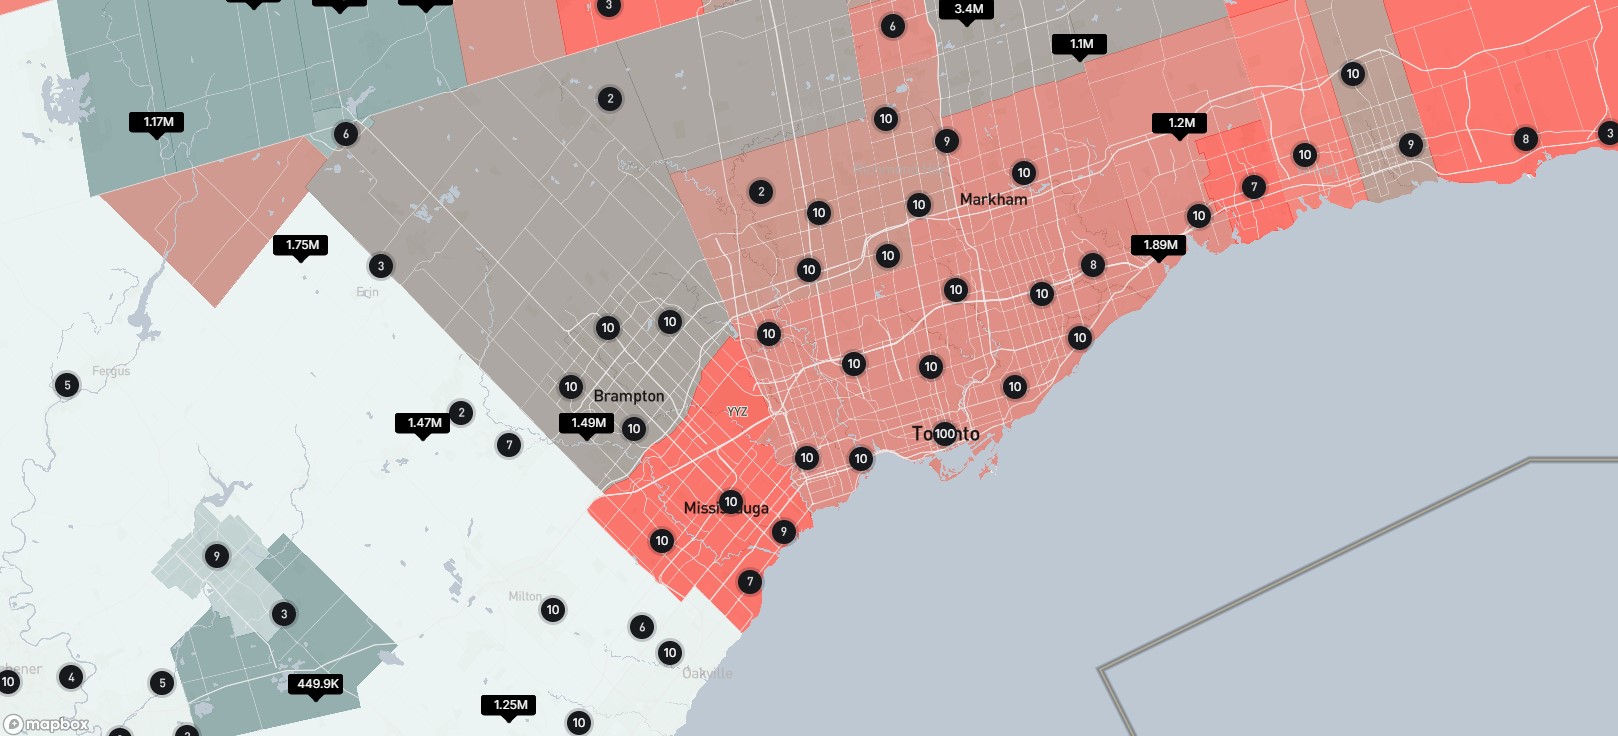
8. Median Prices
Visualize median property prices in specific neighborhoods and subdivisions. Whether you’re setting a budget or pricing a property, this heatmap offers crucial market context.
9. Months of Supply
Gauge market saturation with our Months of Supply heatmap, which calculates how long it would take for current inventory levels to sell out. This tool helps you identify buyer’s and seller’s markets.
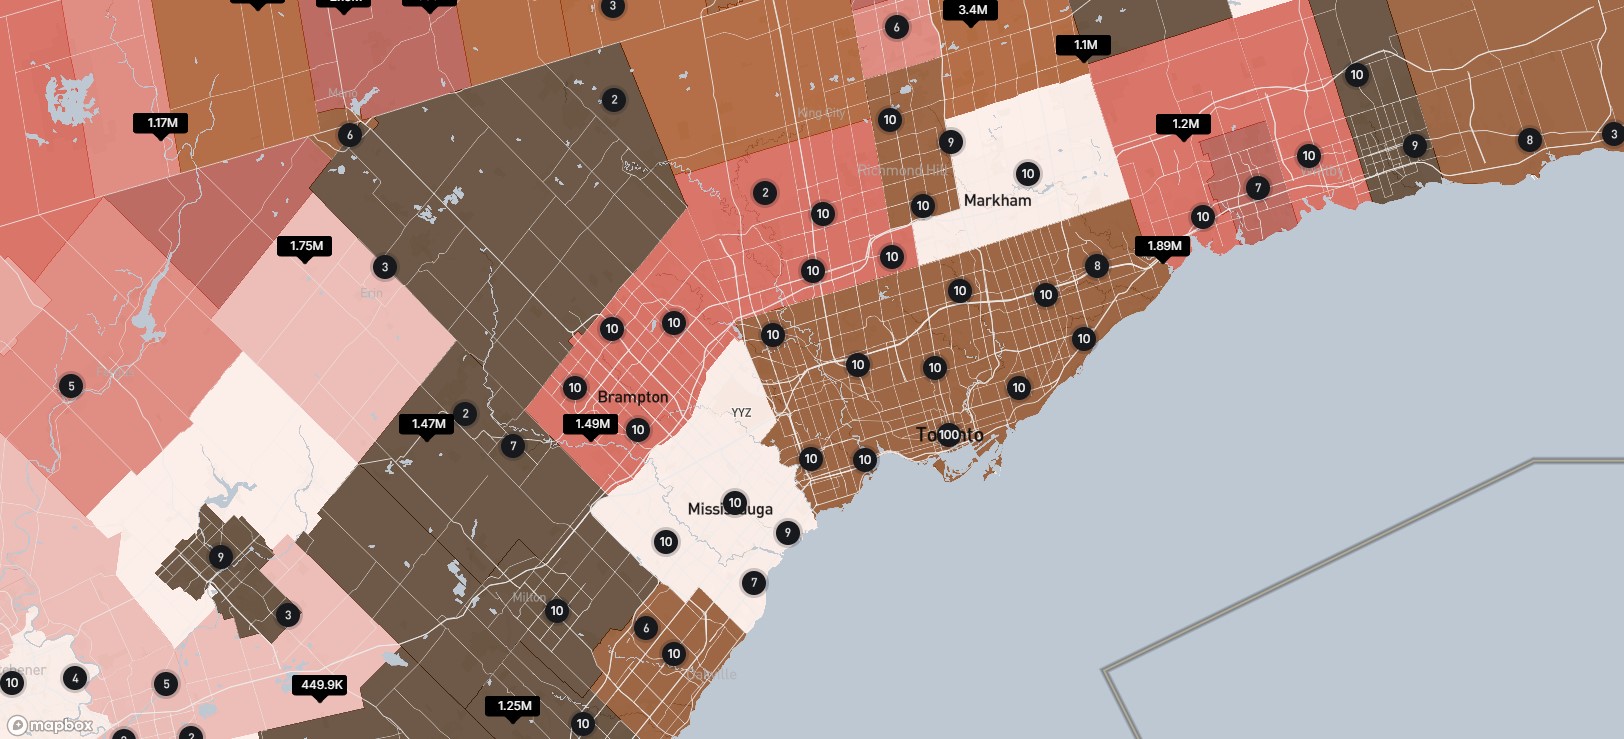
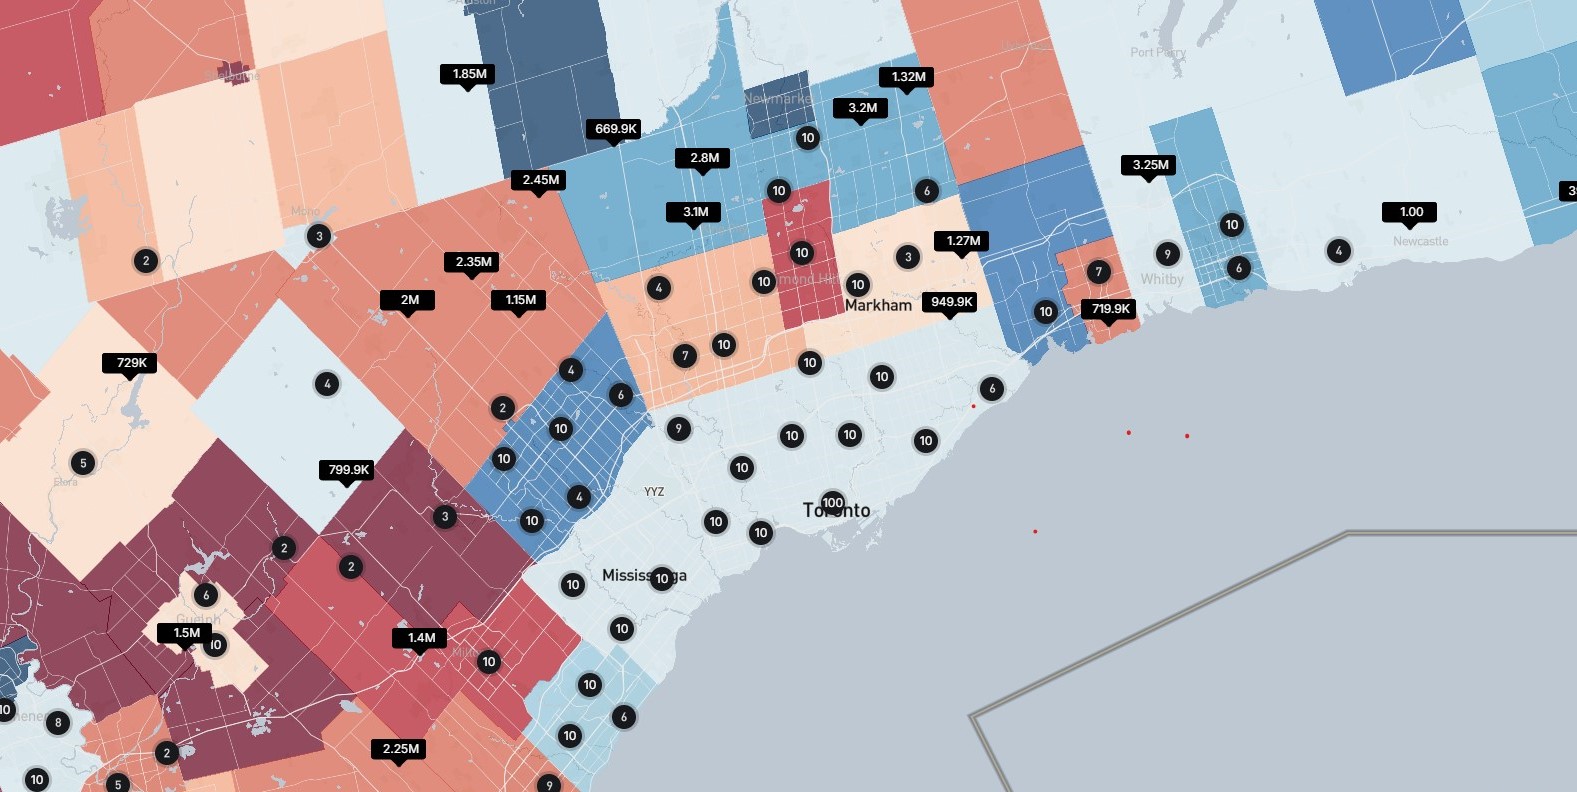
10. Bid-Ask Spread
Evaluate the liquidity and volatility of the real estate market with our Bid-Ask Spread heatmap. A narrow spread often indicates a stable, high-demand market, while a wider spread may suggest greater negotiation opportunities.
Why Choose AI Powered Insights?
- Hyper-Local Data: Our maps drill down to neighborhood and subdivision levels for unmatched granularity.
- Real-Time Updates: Stay ahead with dynamic insights that reflect the latest market conditions.
- User-Friendly Visualization: Intuitive heatmaps simplify complex data, making it accessible to everyone.
- Actionable Insights: Make data-driven decisions for buying, selling, renting, or investing with confidence.
Start Exploring Today
AI Powered Insights is your gateway to unlocking the full potential of real estate analytics. Dive into our heatmaps and discover a new dimension of market intelligence. Whether you’re a first-time buyer, seasoned investor, or industry professional, our tools are tailored to meet your needs.
Visit AI Powered Insights now and revolutionize the way you navigate real estate!